There’s something about bounces
I’ve shared a version of this image repeatedly. I think it was only my Facebook friends that got the stick figure screaming in frustration, though.
The reality is bounce handling is one of the most frustrating pieces of email delivery. Not only that, many people in the email space treat it as a simple process. It’s really not as simple as we’d like it to be.
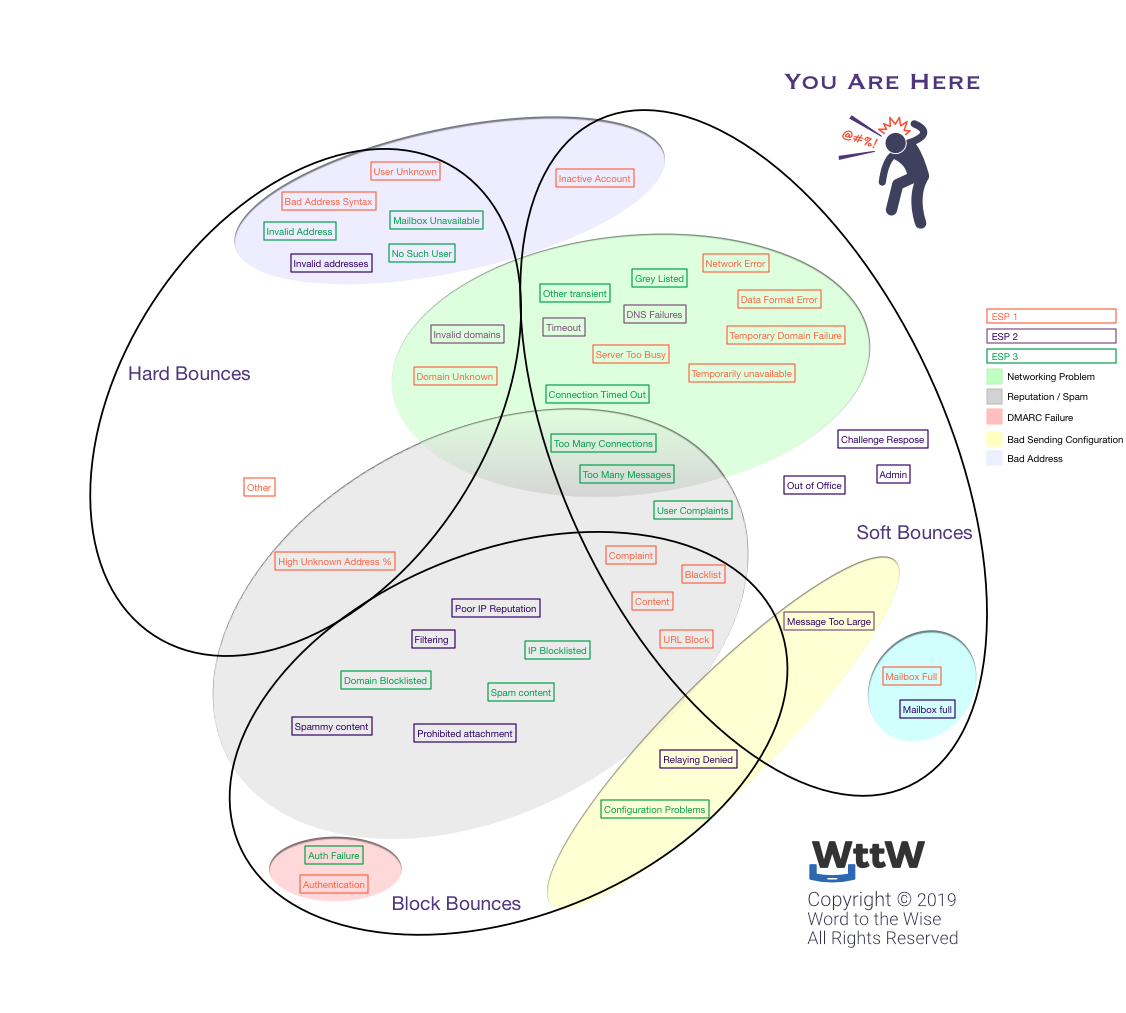
The above image was created based on docs from 3 different ESPs a client was using. They wanted to normalise their bounce handling across ESPs, and asked me for policy recommendations. I ended up digging through a bunch of docs from their 3 ESPs. I recorded the reasons as reported in the docs in a colored block corresponding to the ESP, then dropped them in the appropriate circle: soft, block or hard.
The shaded circles are based on my interpretations of why these bounces happen.
- The big grey circle surrounds bounces due to reputation issues.
- The green circle is primarily networking and technical issues.
- The top purple circle is non existent or bad addresses
Note, nothing here indicates how we should react to the bounces, this is just a categorisation activity. This classification also has nothing to do with what the actual SMTP response is.
Just remember, next time someone says bounce handling is simple: they’re wrong.